
The Best Way to Localize Product Infographics Without Photoshop
There is a point in every cross-border launch where the team realizes the written translation is not the hard part anymore.
The hard part is the infographic.
Someone says the product page is already localized, but the gallery still has English callouts. Someone else asks for the original design file and finds out the PSD is outdated, missing, or built by an agency nobody can reach anymore. Then the fallback plan begins: erase the text, drag in a new text box, hope the spacing still looks decent, export, repeat.
That is usually how a clean product page turns into a messy one.
Product infographics are some of the highest-value assets in e-commerce because they do the explaining that descriptions often cannot do fast enough. They show why the product matters, how it works, what makes it different, and why a shopper should trust it. When these visuals stay in the original language, the storefront feels unfinished. When they are localized badly, the storefront feels cheap.
This guide is about the best way to localize product infographics without Photoshop, especially if your team needs something faster, more repeatable, and less fragile than manual redesign.
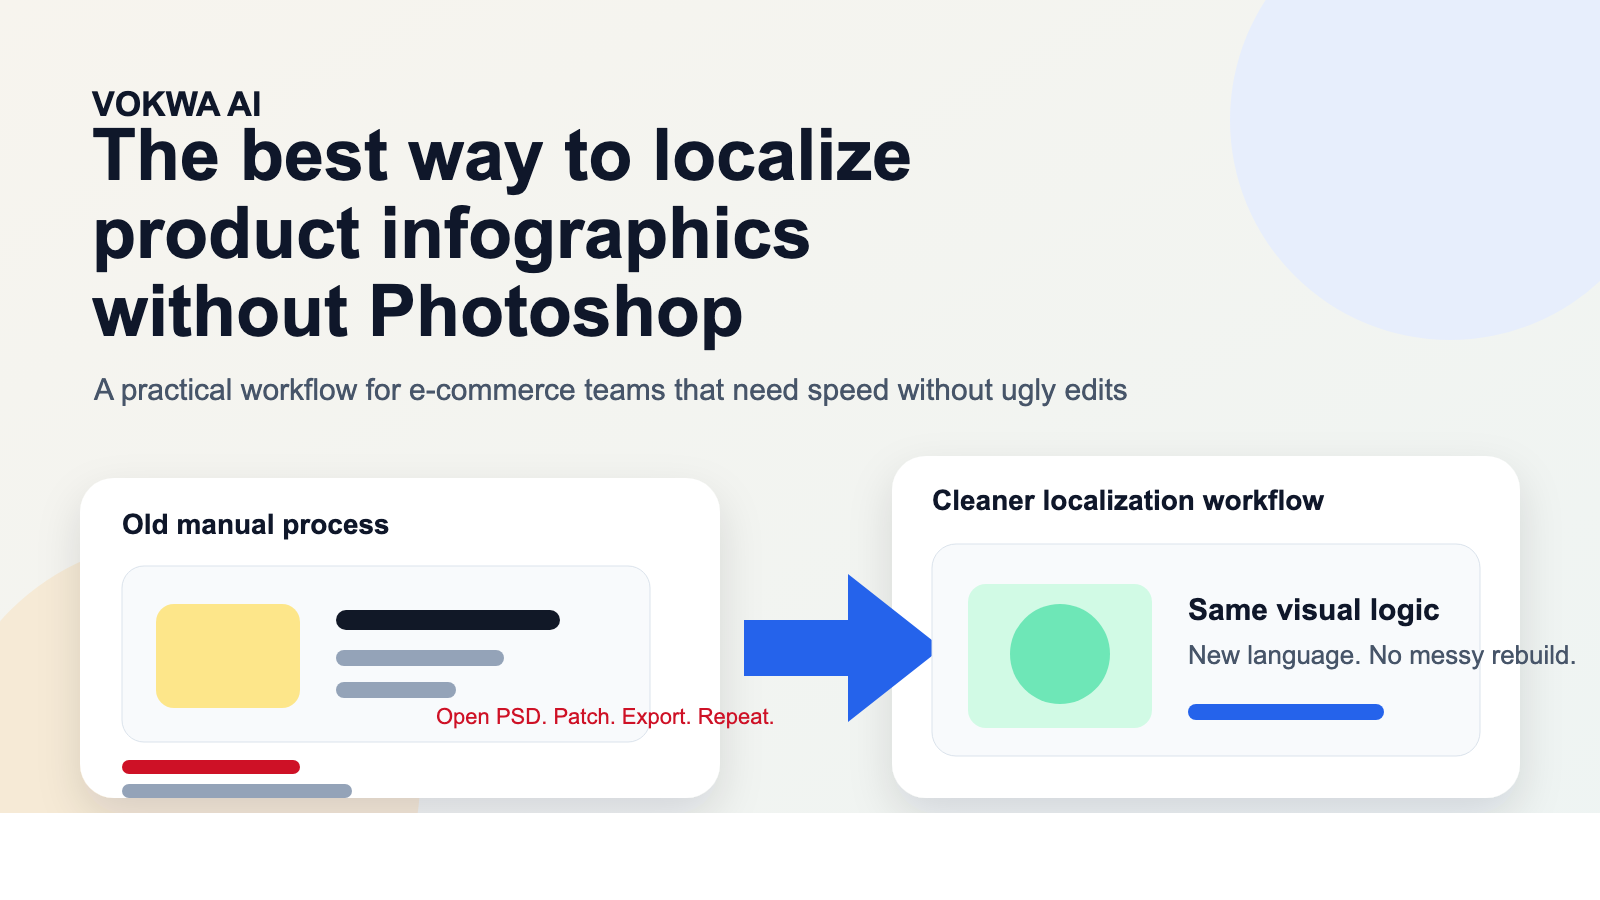 Caption: The goal is not to rebuild every asset. It is to keep the visual logic that already sells and adapt the language layer cleanly.
The short answer
The best workflow is usually not "open the source file and redesign everything."
It is:
- start from the infographic that is already live
- remove the original text cleanly
- replace the text with copy that fits the same visual hierarchy
- review the result like a shopper, not like a designer staring at a file
That sounds simple, but it is where most teams either save time or waste it.
Why Photoshop is often the wrong bottleneck
Photoshop is not the problem by itself. The bottleneck is what Photoshop tends to represent inside real teams:
- dependency on old layered files
- slow back-and-forth with design
- version confusion
- repetitive manual export work
- inconsistent output when different people touch different assets
For one hero graphic, that may be manageable.
For twenty SKUs, multiple languages, and marketplace variations, it stops scaling.
That is why many teams are not actually asking, "Can we do this in Photoshop?"
They are asking:
- Can we localize faster?
- Can we do it without rebuilding every file?
- Can we keep it looking premium?
- Can non-design teams help without destroying the visuals?
That is a very different problem.
What teams usually get wrong
The worst infographic localization mistakes are not dramatic. They are subtle enough to make the visual feel "off" without the team realizing exactly why.
Mistake 1: Treating it like text replacement only
Literal translation plus a pasted text box is not localization. An infographic needs visual rhythm. The replacement copy has to fit the design, not just the language.
Mistake 2: Damaging the background
If the old text is removed with a rough patch, clone mark, or flat-color block, the eye catches it immediately.
Mistake 3: Keeping English sentence structure
What works in one language often becomes too long, too stiff, or too dense in another. Infographic copy should be rewritten for speed and scanability.
Mistake 4: Localizing everything at once
You do not need to touch every visual on day one. Start with the infographics that carry the buying argument.
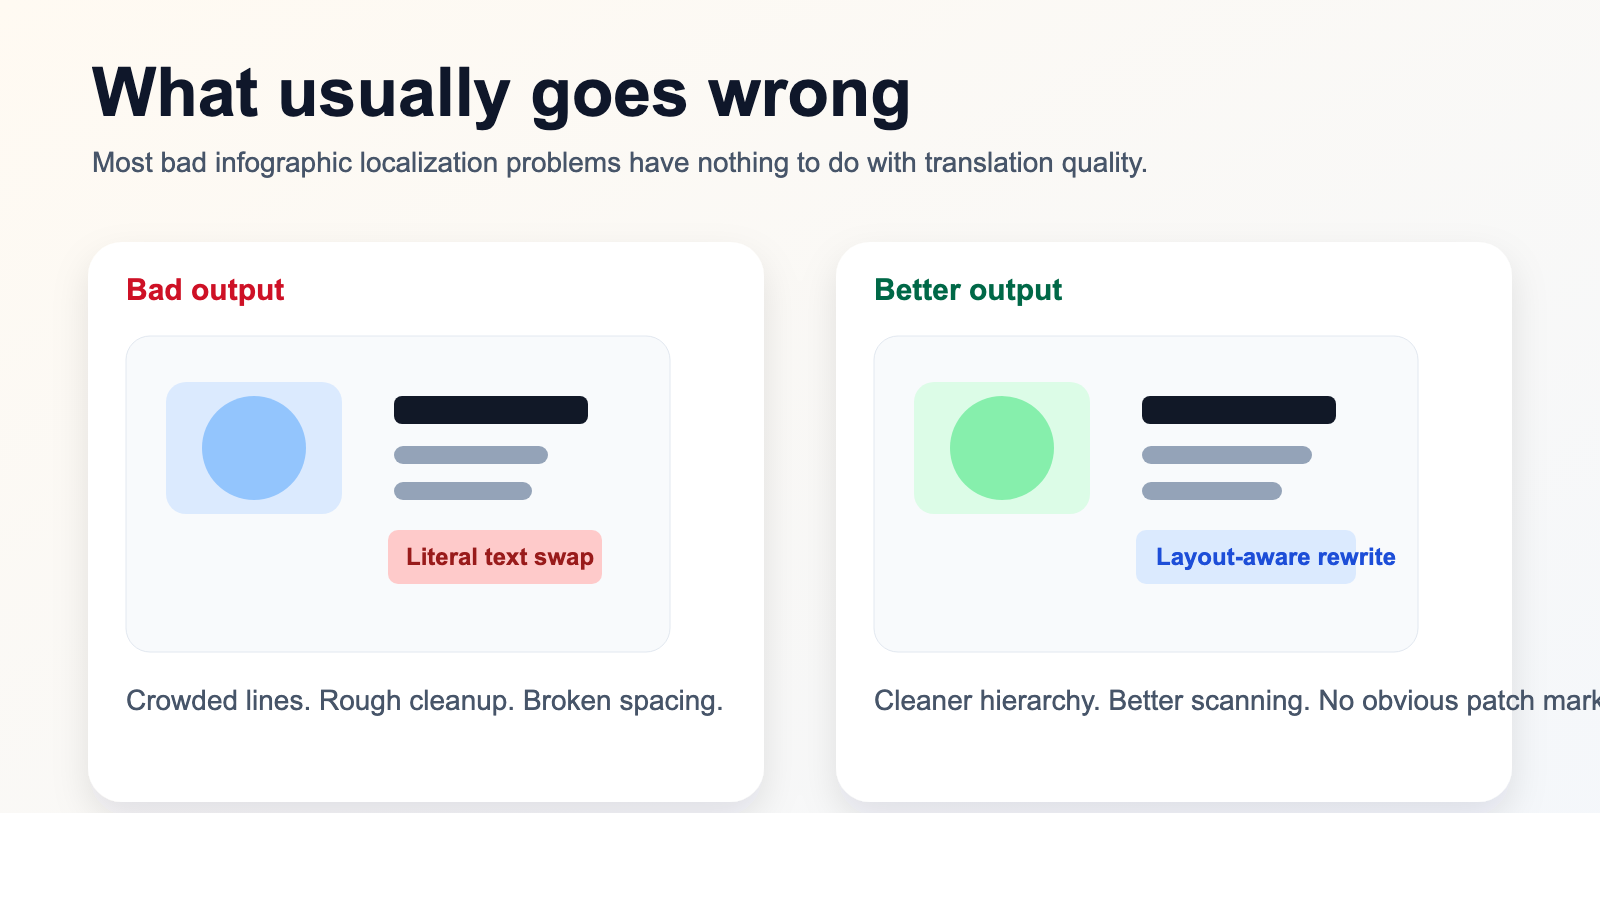 Caption: Most bad results come from workflow shortcuts, not from the language itself.
Which infographics deserve attention first
If your catalog is large, work in priority order.
Start with:
Feature-benefit graphics
These are the infographics that explain:
- what the product does
- why it is better
- what problem it solves
- what makes it worth the price
Instruction panels
Especially useful for beauty, personal care, electronics accessories, home products, tools, and supplements.
Size and dimension graphics
Anything tied to fit, measurements, compatibility, or installation should move up the list fast.
Comparison visuals
"Why choose us" graphics, before/after examples, bundle comparisons, and certification panels often do more persuasion than the long description.
Ad creatives with infographic structure
If the paid campaign or marketplace tile already contains product messaging, it should be localized as part of the same system.
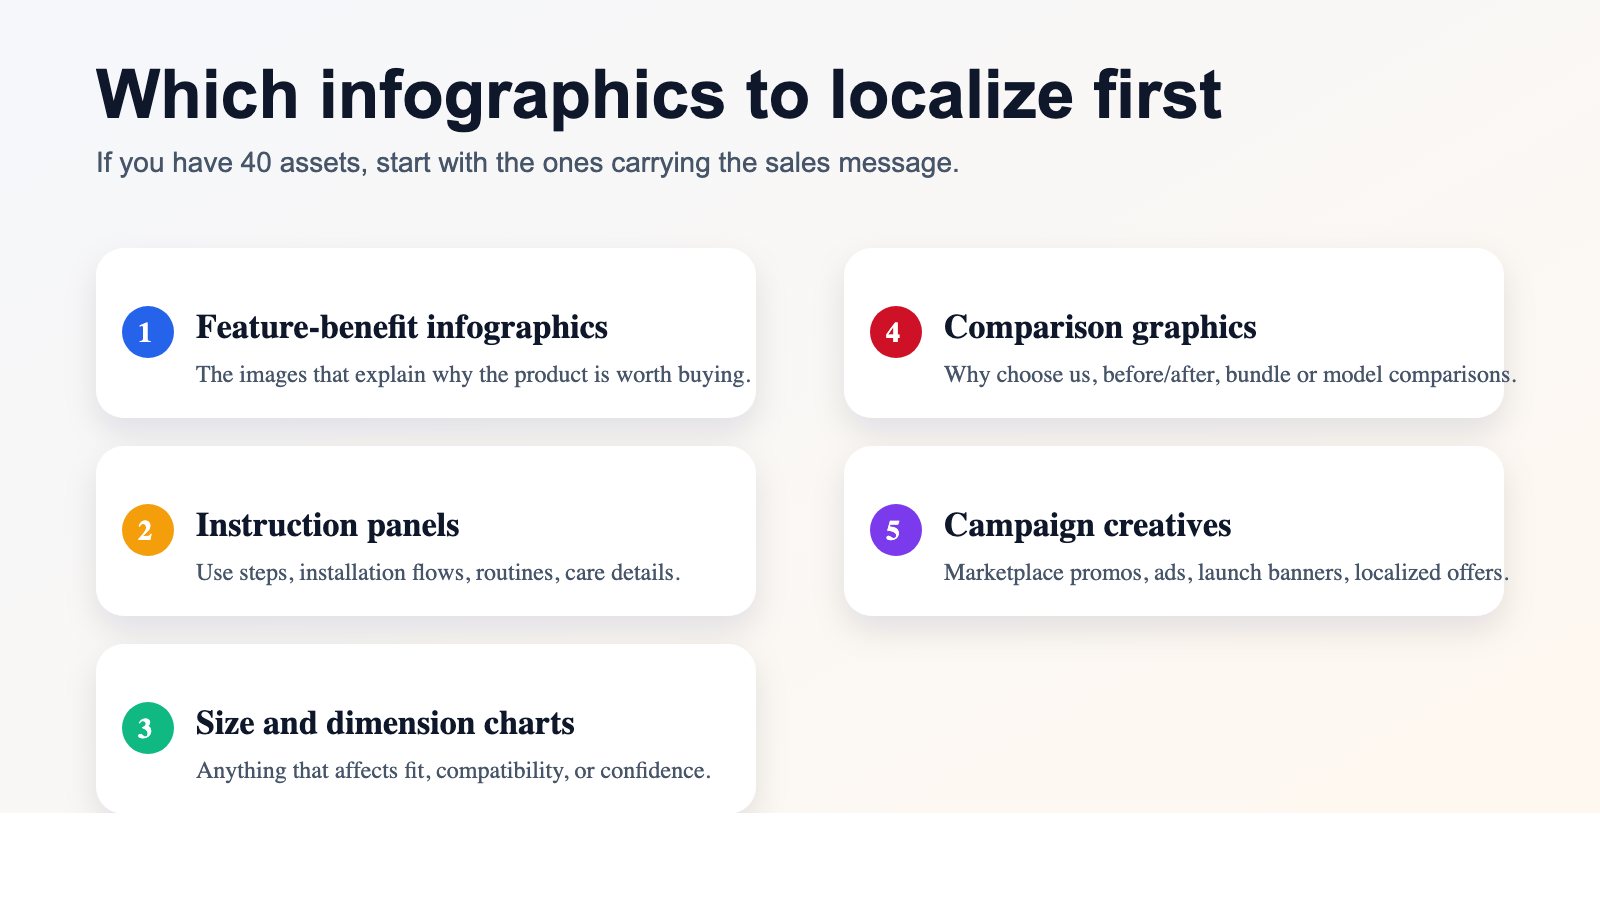 Caption: You get more value by localizing the explanatory visuals first than by touching low-impact decorative assets.
What the best workflow actually looks like
The most efficient teams usually follow a sequence like this:
Step 1: Work from the asset that is already performing
Do not start by redesigning the infographic. Start from the version that is already selling.
That means you preserve:
- layout
- product photography
- icon logic
- visual hierarchy
- emphasis structure
You are adapting the communication layer, not reinventing the creative idea.
Step 2: Remove the old text carefully
This step matters more than people expect. Once the background is damaged, the rest of the infographic starts to feel fake.
Good replacement work should preserve:
- shadows
- gradients
- texture
- card edges
- spacing around visual elements
Step 3: Rewrite for the infographic, not for the paragraph
One of the biggest mistakes in localization is copying page-copy rules into visual-copy situations.
Infographic text needs to be:
- shorter
- punchier
- easier to scan
- visually balanced
- aligned with the design hierarchy
This is where layout-aware rewriting beats literal translation.
Step 4: Review on real screens
A file can look acceptable zoomed in on a desktop monitor and still feel clumsy on mobile or inside marketplace crops.
Always check:
- small-screen readability
- spacing around icons
- line breaks
- headline emphasis
- whether the image still feels native and polished
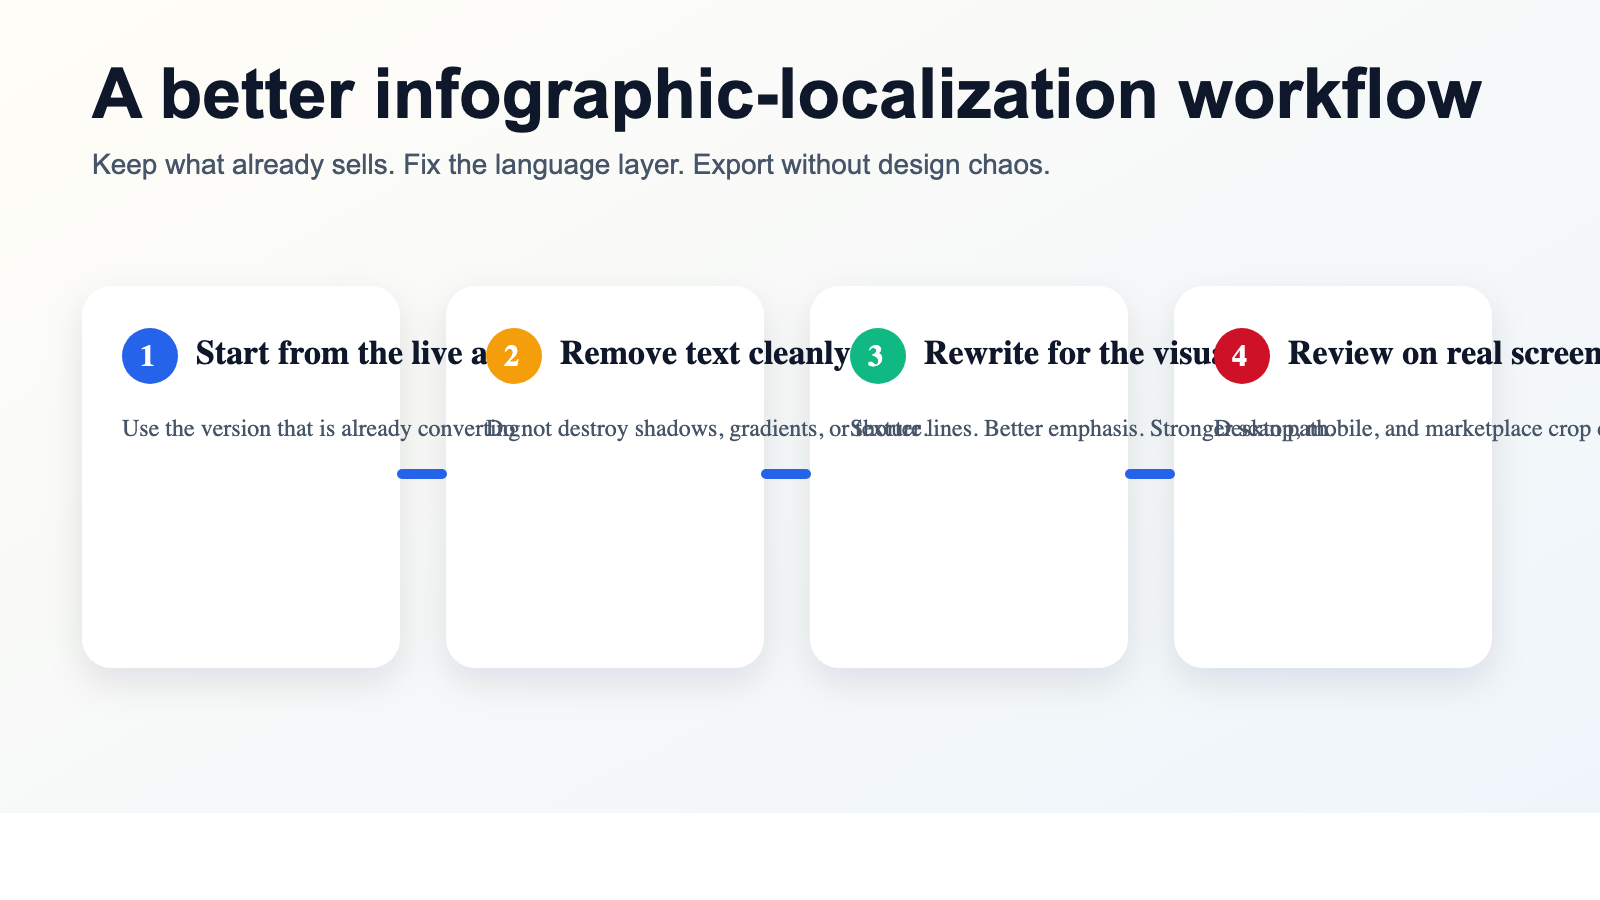 Caption: The fastest route is usually not more manual design work. It is a more disciplined localization workflow.
Where this approach is most useful
This workflow becomes especially helpful when:
Your team has strong English assets but weak file hygiene
Maybe the layered source files exist, maybe they do not. Either way, you cannot build a scalable localization process around hunting them down.
You localize the same product across multiple channels
If the infographic appears on Shopify, Amazon, Mercado Libre, paid social, and partner decks, keeping the visual consistent matters more than preserving the original file format.
You need speed without sacrificing polish
Many teams are willing to move fast. The real challenge is moving fast without making the graphics look obviously edited.
The design team is already overloaded
In many companies, designers should not be spending entire weeks rebuilding the same product argument in different languages one text box at a time.
Why VOKWA AI fits this type of work
VOKWA AI is useful here because the job is not simply "translate words."
It is:
- remove the original text cleanly
- reconstruct the background believably
- replace the message in a way that still fits the infographic
- export a localized asset that looks ready to publish
That matters because product infographics are not documents. They are sales assets. If they stop looking premium, they stop doing their job.
Final thought
The best way to localize product infographics without Photoshop is usually not to pretend Photoshop does not exist. It is to stop making the entire workflow depend on reopening old design files for every single language change.
Start with the assets that already work. Protect the layout that already sells. Rewrite the visual copy so it still scans naturally. And review the result like a shopper who has never seen the original version.
That is what turns localization from a design bottleneck into a repeatable operating system.
If you need a faster way to localize product infographics without rebuilding them by hand, VOKWA AI can help you turn existing visuals into publish-ready assets for new markets.
FAQ
Do I need Photoshop to localize product infographics?
Not necessarily. If the workflow can cleanly remove in-image text, preserve the background, and replace the copy while keeping the layout intact, many infographic-localization tasks can happen without reopening the original design file.
What should I localize first?
Start with the infographics that explain value, usage, size, compatibility, or differentiation. Those images usually affect conversion the most.
Why do localized infographics often look awkward?
Usually because the replacement text was inserted literally, without rewriting for the visual layout. Most of the problem is spacing, hierarchy, and background quality.
Is this better than redesigning everything manually?
For many teams, yes. Reusing strong existing assets is usually faster and more scalable than rebuilding every infographic from scratch.